← All work Business × Product · IRDAI open data

Group health in India: choosing insurers and fixing the claim journey

Data IRDAI Annual Report 2024-25, 29 insurersMethod Partner screen, renewal stress test, claims funnelFramed for Plum (independent, not affiliated)
TL;DR

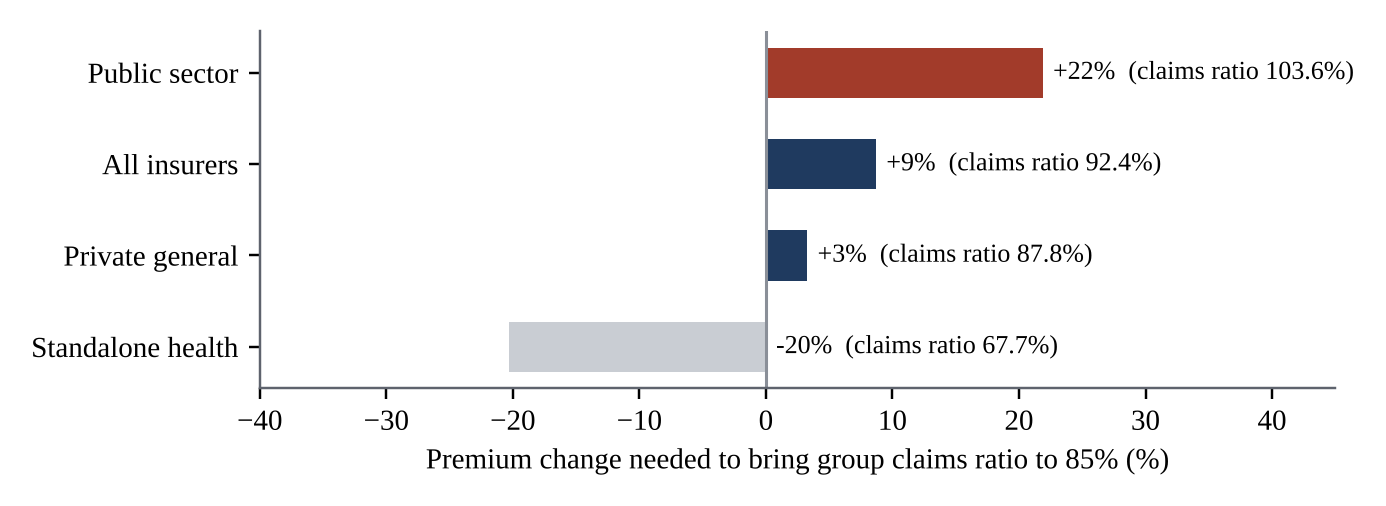
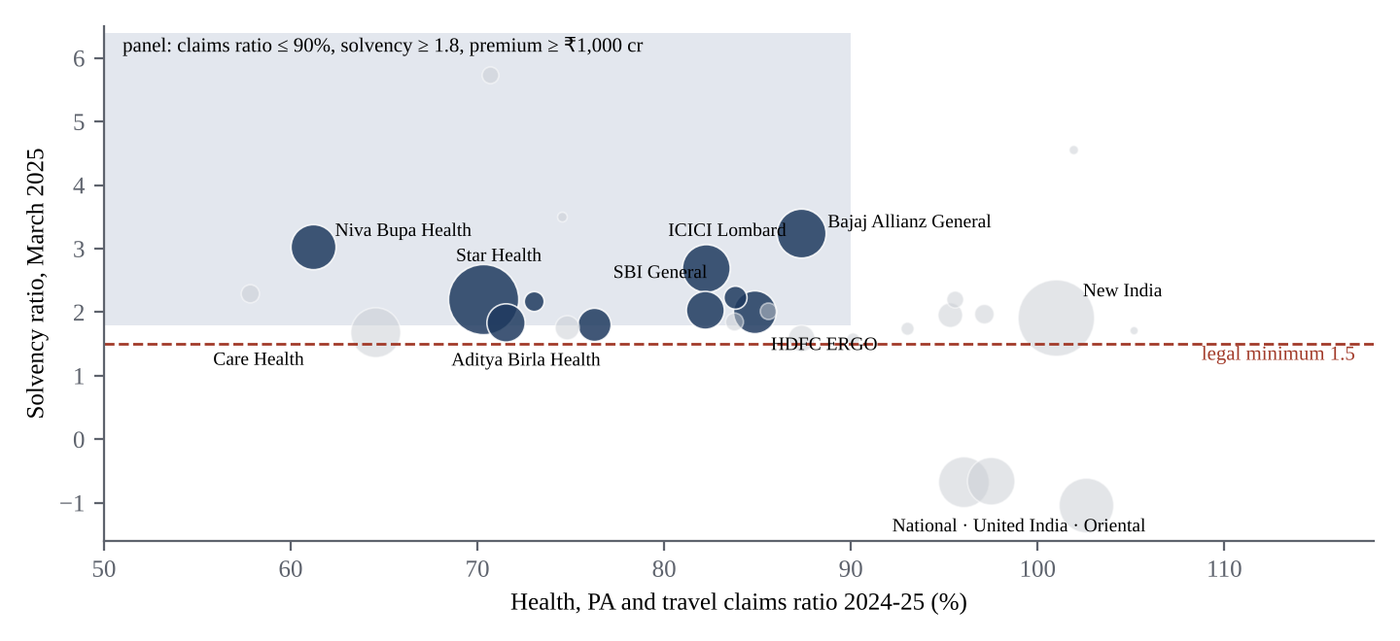
Public-sector insurers write 36% of health premium but would need about 22% higher group premiums to reach an 85% claims ratio. Ten insurers that are profitable, solvent and growing write 48% of the market. In the claim journey, deductions take 14% of every rupee claimed, more than outright rejections. Build on the ten, flag at-risk renewals early, and make deductions visible before admission.

Open the full report (PDF, 12 pages) ↗Executive summary, partner strategy, claims funnel, roadmap and dashboard specification

The question

A group-health platform places its clients' risk with insurers. Renewal depends on two things it does not control directly: how insurers price at renewal, and how employees experience claims. Which insurers should it build on, and where should its product team intervene?
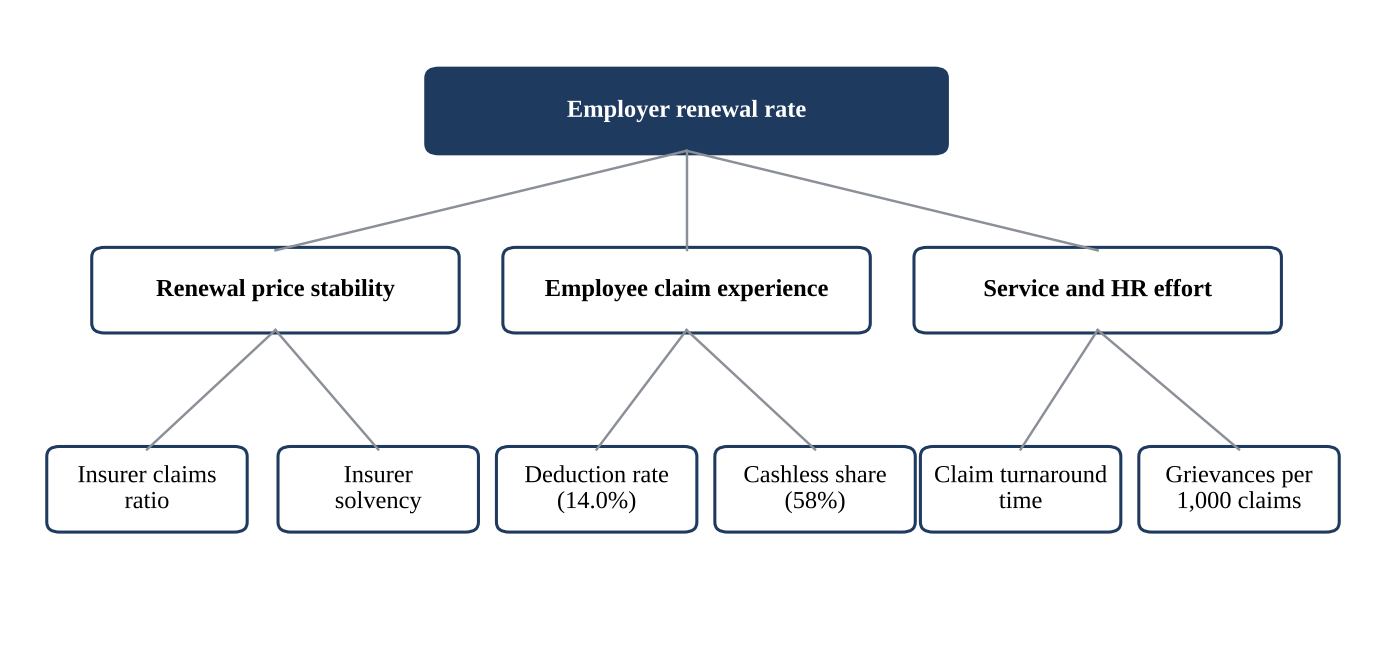
The KPI tree behind the analysisThe KPI tree behind the analysis
Employer renewal splits into renewal price stability, employee claim experience, and service and HR effort.

Big, growing and thin-margin

₹61,435 crgroup health premium, up 10.4% in 2024-25
92.4%of group premium paid out as claims
103.6%group claims ratio at public-sector insurers
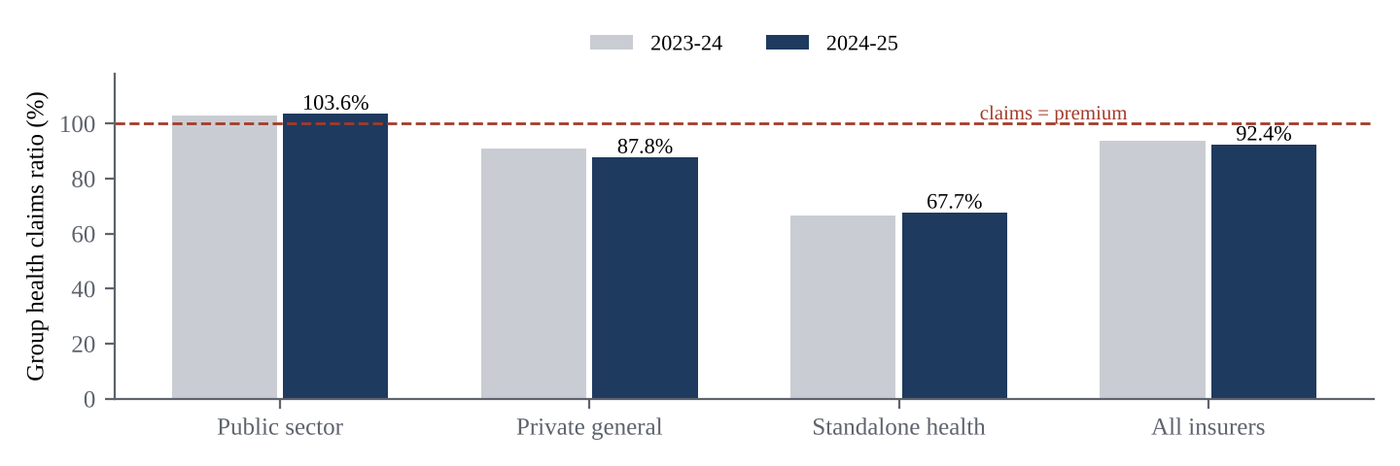
Public-sector insurers lose money on group healthPublic-sector insurers lose money on group health
Group health claims ratio by insurer type, 2023-24 and 2024-25.

Partner strategy

The renewal-price stress testThe renewal-price stress test
Premium change needed to bring group claims ratio to 85%: about +22% for public-sector insurers, +3% for private general insurers.
A ten-insurer panelA ten-insurer panel
Claims ratio of 90% or less, solvency of at least 1.8, over ₹1,000 crore of health premium: 48.0% of the market, a weighted claims ratio of 76%, and 11.2% growth against 5.3% for the public sector.

The panel is robust: loosening the claims-ratio threshold to 95% adds no one, and solvency is the threshold that actually moves the list.

Where the claim journey leaks
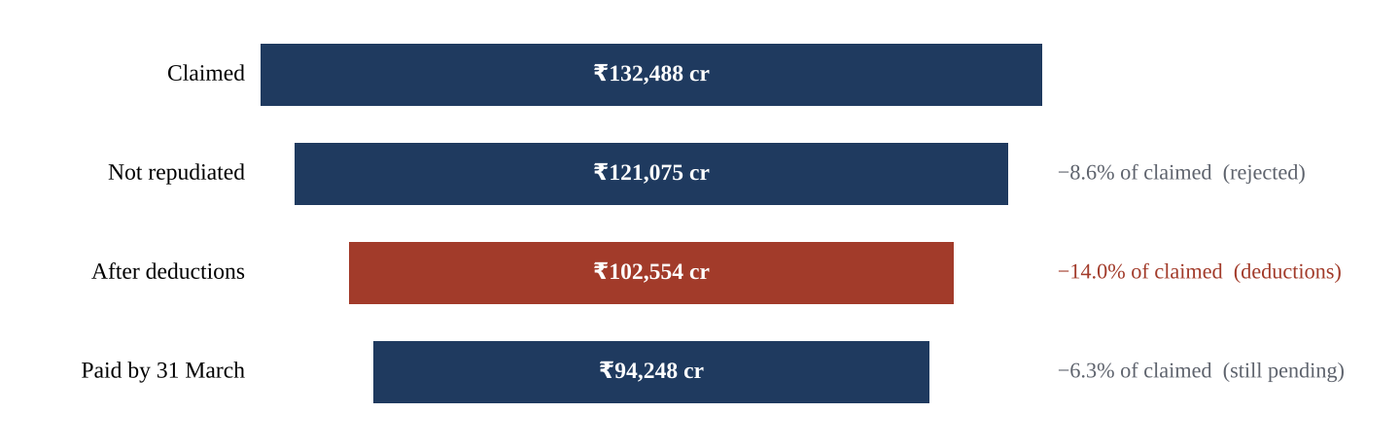
Deductions are the biggest leakDeductions are the biggest leak
Of ₹1,32,488 crore claimed, 8.6% was rejected and 14.0% deducted from claims that were paid: about ₹5,700 per claim paid, against an average payment of ₹28,900.

Count-based reporting says 87.5% of claims were paid and hides deductions completely. Cashless covers 58% of paid claims, and the regulator's 2024 rules (pre-authorisation within one hour, discharge within three) give a platform a lever to push it further.

Recommendations
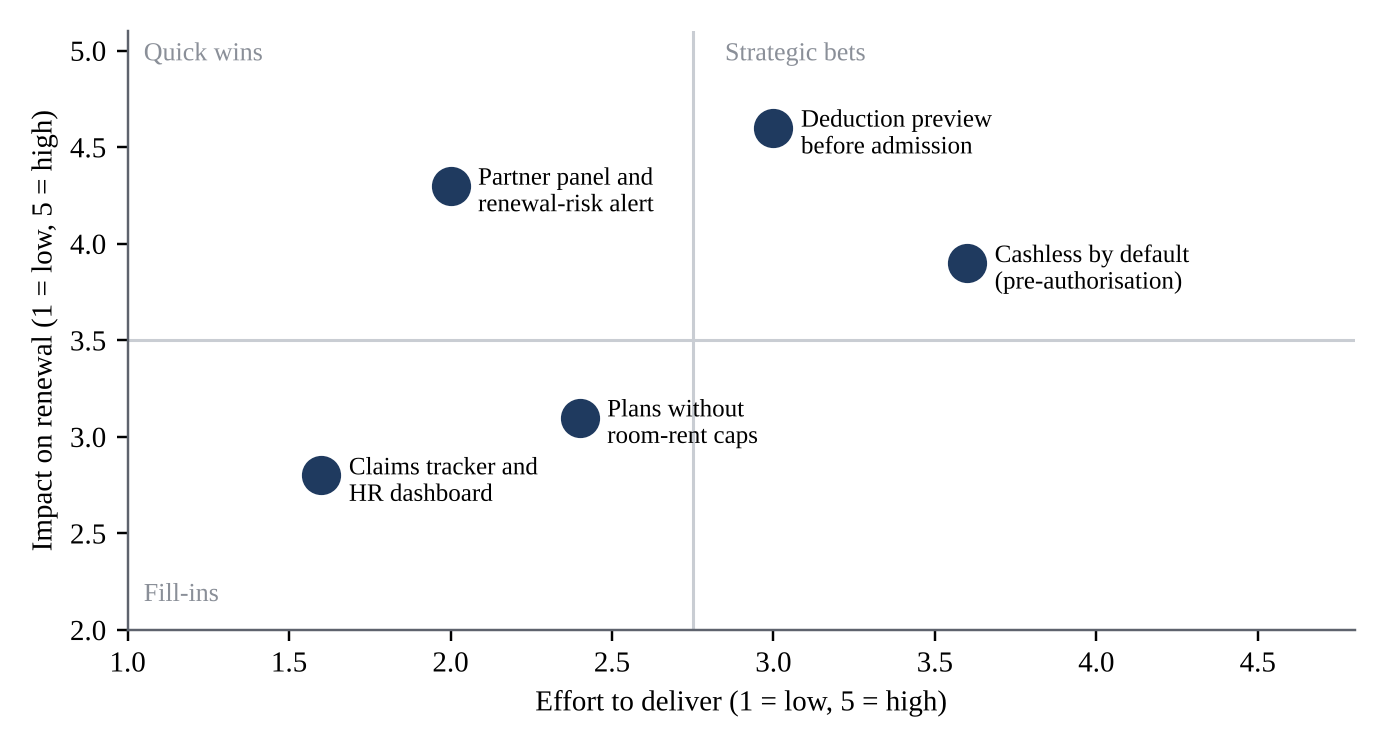
Prioritising the initiativesPrioritising the initiatives
Initiatives by estimated impact on renewal and effort to deliver.
  • Build placements on the ten-insurer panel and present it as evidence-based insurer selection.
  • Flag at-risk renewals 90 days ahead for clients with insurers above a 100% claims ratio or below the solvency minimum.
  • Make deductions the north-star claims metric and show employees their likely deduction before admission.
  • Push cashless by default and publish turnaround against the one- and three-hour rules.

All figures

Select a figure to enlarge it.

Check it yourself