← All work Business intelligence · Company report

Mulberry's FY2022 recovery was real, but smaller and more fragile than it looked

Data Mulberry annual reports FY2018 – FY2022Method Ratio, competitor, quality-of-earnings and sensitivity analysisPeer Ted Baker PLC
TL;DR

Revenue rose 32.6% to £152.4m with a record 71.7% gross margin, and Mulberry beat Ted Baker on liquidity and profitability. But underlying profit was £14.6m, not £21.3m, operating costs rose 22% as stores reopened, and a slip in margin back to about 61% would wipe out most of the profit. Verdict: hold, with conditions.

Open the full report (PDF, 20 pages) ↗Financials, ratios, competitor and market analysis, SWOT, KPI framework

Context

Mulberry is a British luxury brand founded in Somerset in 1971, best known for leather bags, about half of which it makes in its own Somerset factories. In FY2022 (53 weeks to 2 April 2022) revenue recovered to £152.4m, 90% of its FY2018 level.
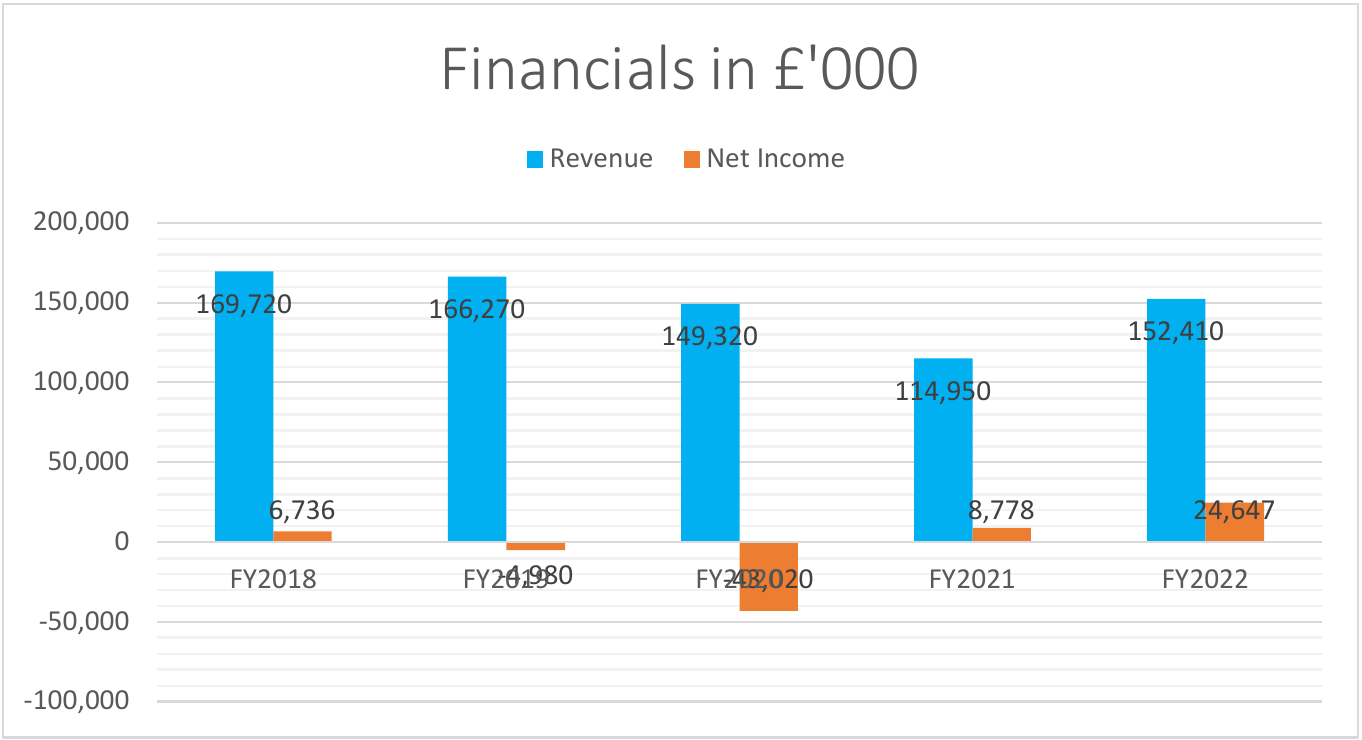
Revenue and profit, FY2018 to FY2022Revenue and profit, FY2018 to FY2022
Revenue (cyan) and profit (tangerine), £'000. Source: Mulberry, Annual Report and Accounts 2022.

Quality of earnings

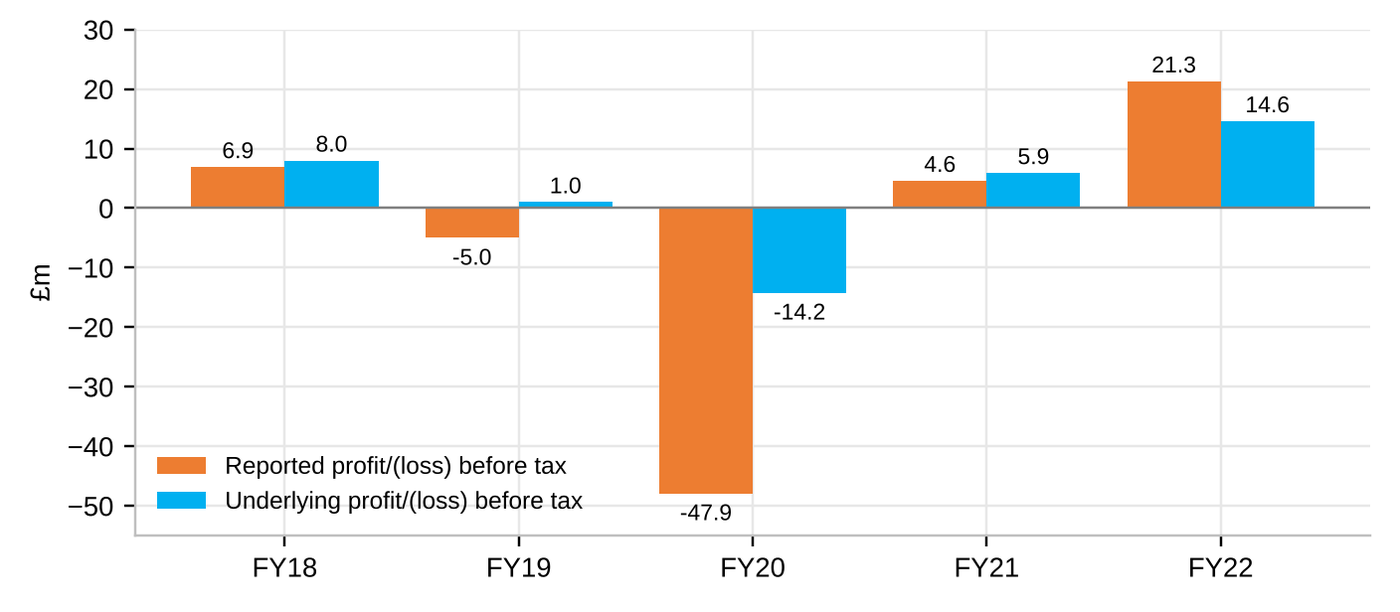
£14.6munderlying profit before tax, FY2022 (reported £21.3m)
£5.7mone-off gain from exiting the Paris store lease
£4.8mfurlough support behind FY2021's £4.6m profit
Reported versus underlying profitReported versus underlying profit
Reported and underlying profit or loss before tax, FY2018 to FY2022, £m.
Growth came back through the storesGrowth came back through the stores
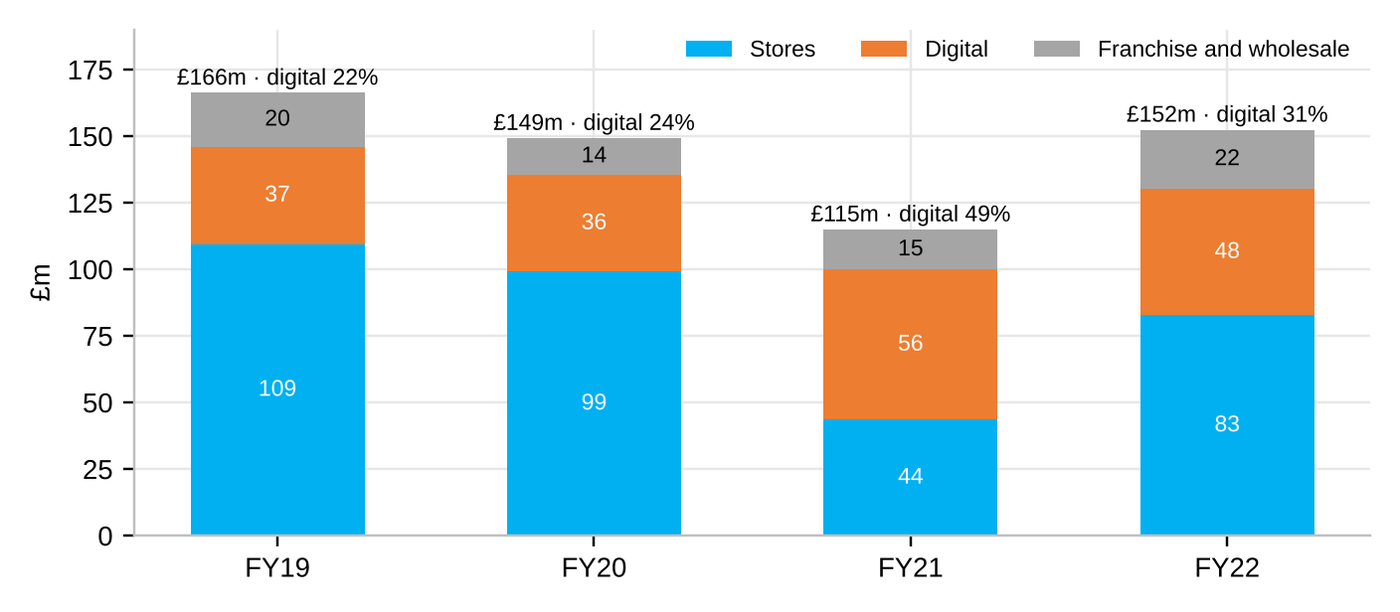
Revenue by channel, FY2019 to FY2022: digital fell 16% as stores nearly doubled.

Ratios against Ted Baker

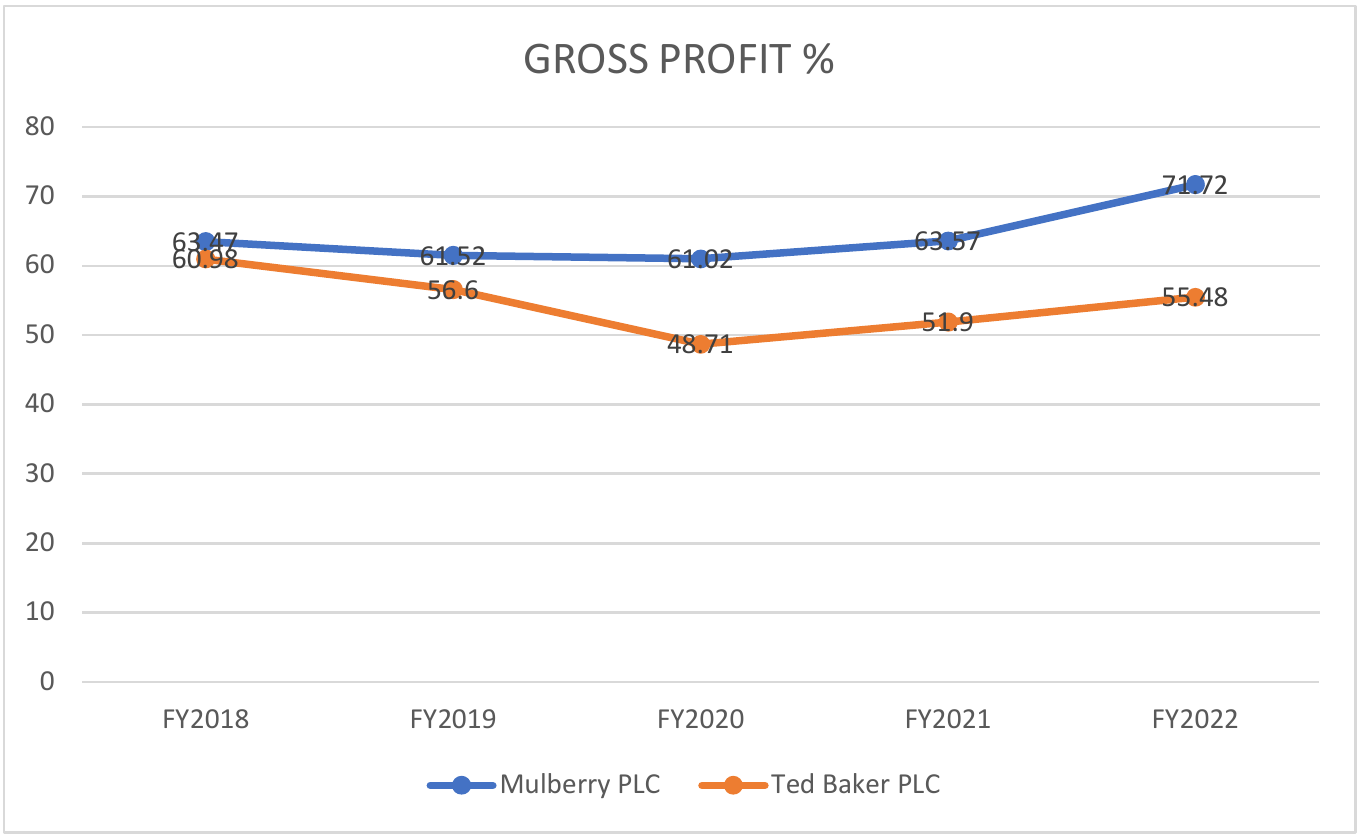
Mulberry ended FY2022 with a current ratio of 1.88 against Ted Baker's 1.34, a gross margin of 71.7% against 55.5%, and a net margin of 13.1% while Ted Baker lost money. Margin, not scale, is what protected Mulberry.
Gross margin is the structural advantageGross margin is the structural advantage
Gross profit margin, Mulberry and Ted Baker, FY2018 to FY2022.
What the liquidity ratios missWhat the liquidity ratios miss
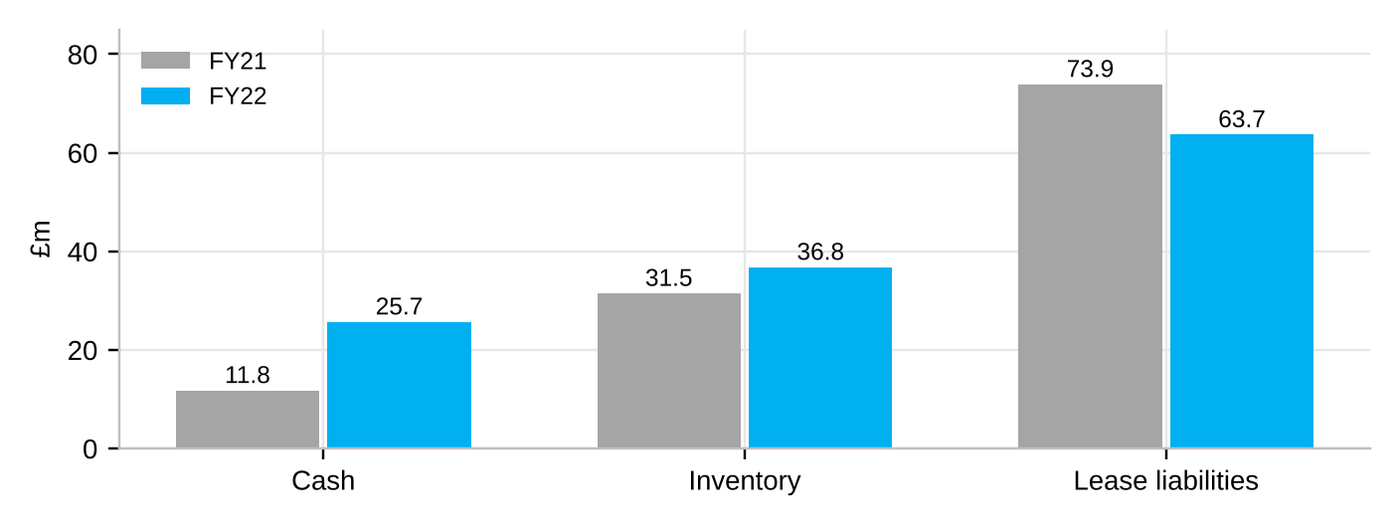
Cash, inventory and lease liabilities: £63.7m of leases against £25.7m of cash means lease-adjusted net debt of about £38m; inventory is about 311 days of cost of sales.

Operating leverage and sensitivity

Break-even revenue rose with costsBreak-even revenue rose with costs
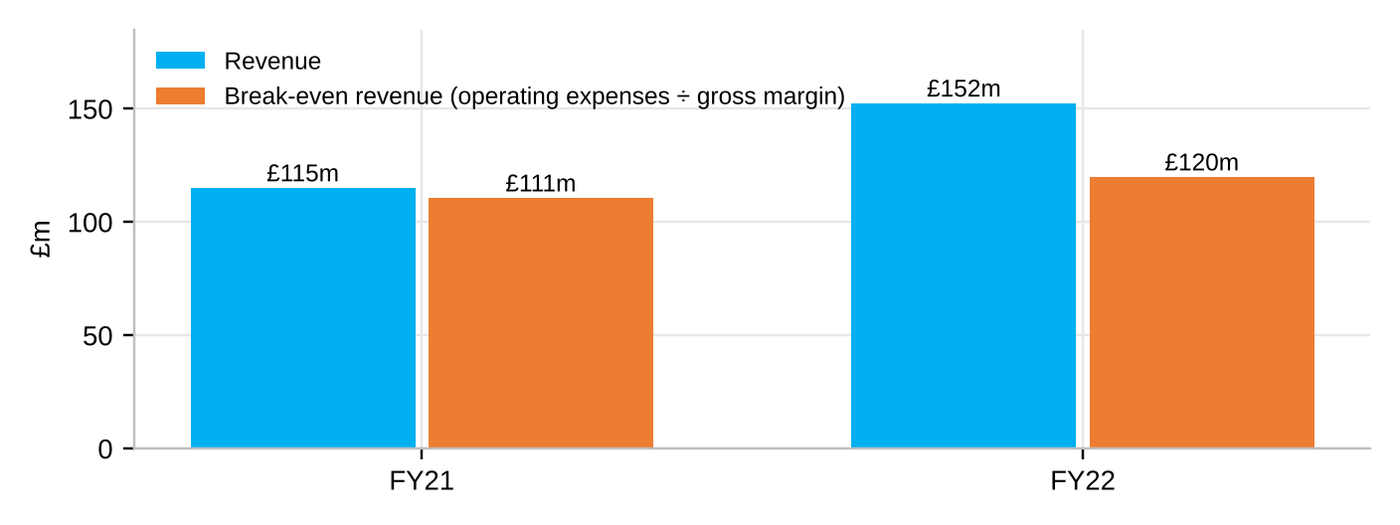
Revenue against break-even revenue (operating expenses ÷ gross margin): £111m in FY2021, £120m in FY2022.

At FY2022 costs, a fall in gross margin to its pre-pandemic level of about 61% would cut operating profit from £23m to £7m. Protecting full-price sales is the single most important lever.

Recommendation

  • For investors: hold, with conditions. Hold while gross margin stays above 65% and operating costs grow more slowly than revenue.
  • For management: protect full-price sales, hold cost growth below revenue growth, reduce UK dependence (69% of retail revenue) through Asia Pacific and partners, and keep digital above a third of revenue.

All figures

Select a figure to enlarge it.