The decision at stake
Councils and funders use the Index of Multiple Deprivation rank to decide where money goes. The single score assumes its seven domains move together. If one domain behaves differently, areas deprived mainly in that domain look better off than they are.
- How are the seven domain scores related?
- Can neighbourhoods be grouped into distinct deprivation profiles?
- Where are those profiles in England?
Data and approach
- CDRC shapefile of IMD 2019 (32,844 areas, 317 districts) joined to the ONS district-to-region lookup; every area matched, no missing values or duplicates.
- Three domains are strongly right-skewed (1.20 to 1.34), so I used Spearman correlation and z-scored every domain before clustering.
- K-means with 25 random starts and a fixed seed, fitted for both three and four clusters, then cross-tabulated.
Findings
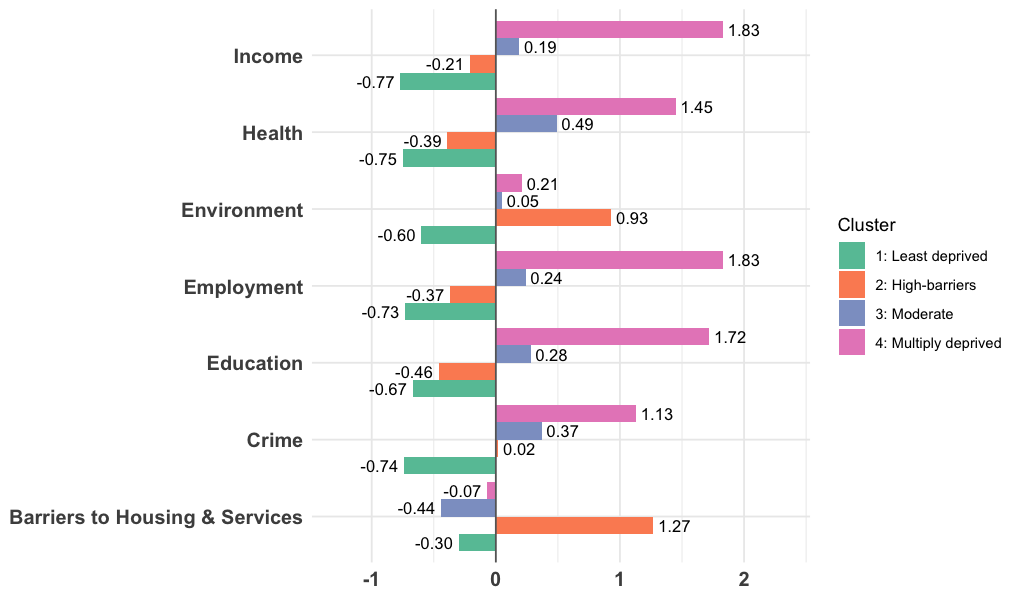
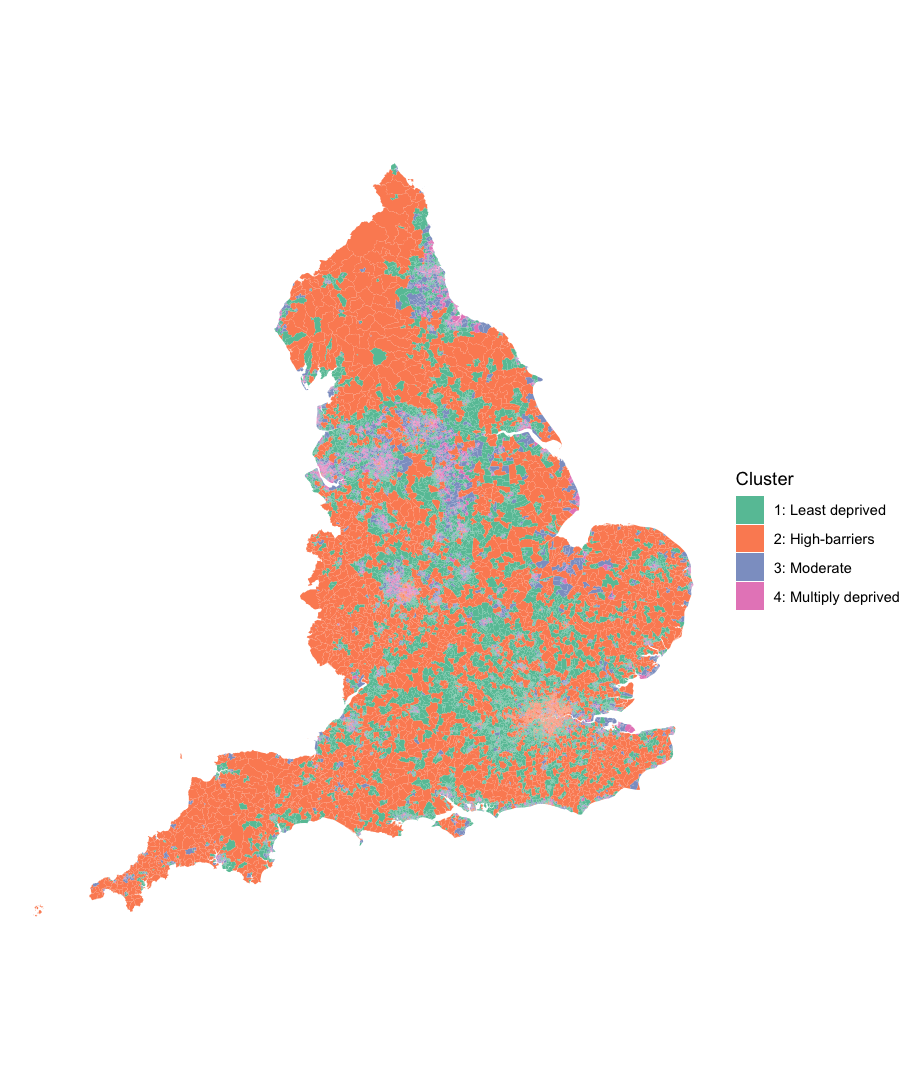
Inside the high-barriers group, the cause differs by place. London areas score +4.29 on wider barriers (affordability, overcrowding) and −0.63 on geographical barriers. Outside London it reverses: +1.04 geographical (distance to GP, school, shops) and −0.47 wider. The published barriers score averages two parts that move in opposite directions, so it partly cancels itself out.
All figures
Select a figure to enlarge it.
Recommendation
For anyone allocating funding by IMD rank: add a second screen on the barriers domain and read its two sub-domains separately.
- London high-barriers areas: affordability and overcrowding programmes.
- Rural high-barriers areas: transport and service-access programmes.
- Tradeoff: a second screen adds complexity to a ranking people trust because it's simple.
Limitations
- Results describe areas, not people (ecological fallacy).
- One year of data, so no view of change over time or cause.
- K-means puts each area in exactly one group, which simplifies mixed areas.
Under the hood
domains_z <- scale(select(imd_flat, all_of(domain_cols)))
set.seed(1234)

km3 <- kmeans(domains_z, centers = 3, nstart = 25, iter.max = 50)
km  <- kmeans(domains_z, centers = 4, nstart = 25, iter.max = 50)

# Does the high-barriers group survive with k = 3?
table(km3$cluster, km$cluster)   # it splits 4,110 / 2,249

# Join check: every area must get a region
imd <- left_join(imd, lookup, by = "lad_code")
sum(is.na(st_drop_geometry(imd)$region))   # 0
The full script is in the appendix of the report and runs end to end.