The question
Is the world genuinely moving away from conventional energy, and is that shift fair? Fairness matters because the policy questions are who cuts first, who caused the most, and who pays, and no single metric answers them.
Five charts, one story
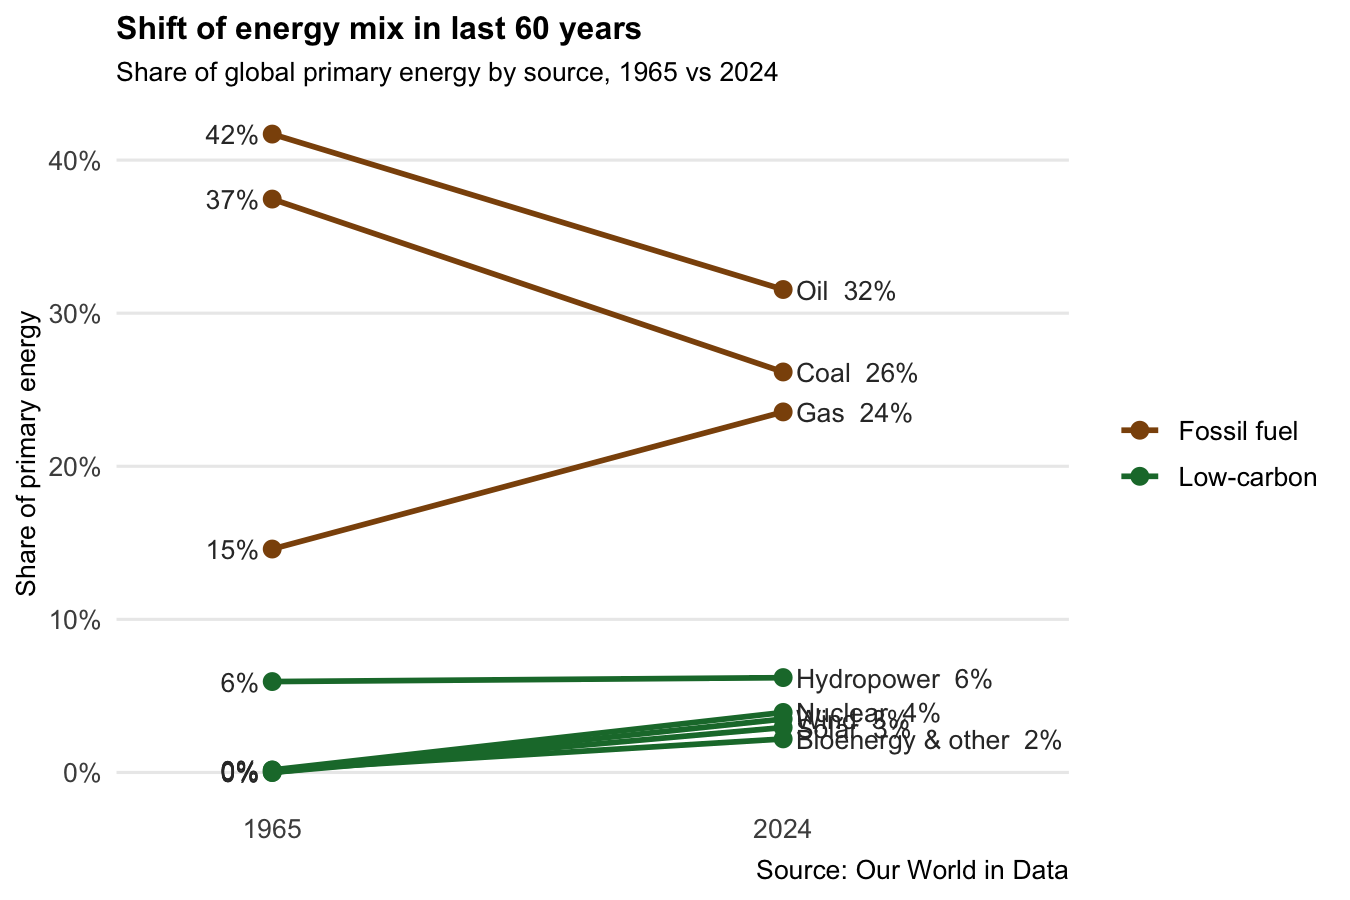
The chart most likely to mislead
Figure 1 shows shares, not totals. Shares fell while total consumption grew, so a quick reader could conclude fossil fuel use dropped when it rose. Comparing only two years also hides the 1970s oil shocks and the 2000s coal expansion.
- Pair it with total energy consumption, which the same dataset already holds.
- Add one or two intermediate years, or small multiples per source.
- Add per-person energy use to separate population growth from demand.
Accessibility
- Colour-blind-safe palette; colour never carries meaning alone.
- Direct labels at line ends instead of legends.
- Fixed 0–100% axes so differences aren't exaggerated.
- Next: a short text description under each image for screen readers.
All figures
Select a figure to enlarge it.