The question
E-bikes cost far more to buy, charge and maintain than classic bikes. When Santander Cycles added about 230 e-bikes in August 2025, did the extra fleet pay for itself, and where should the next pound of fleet investment go?
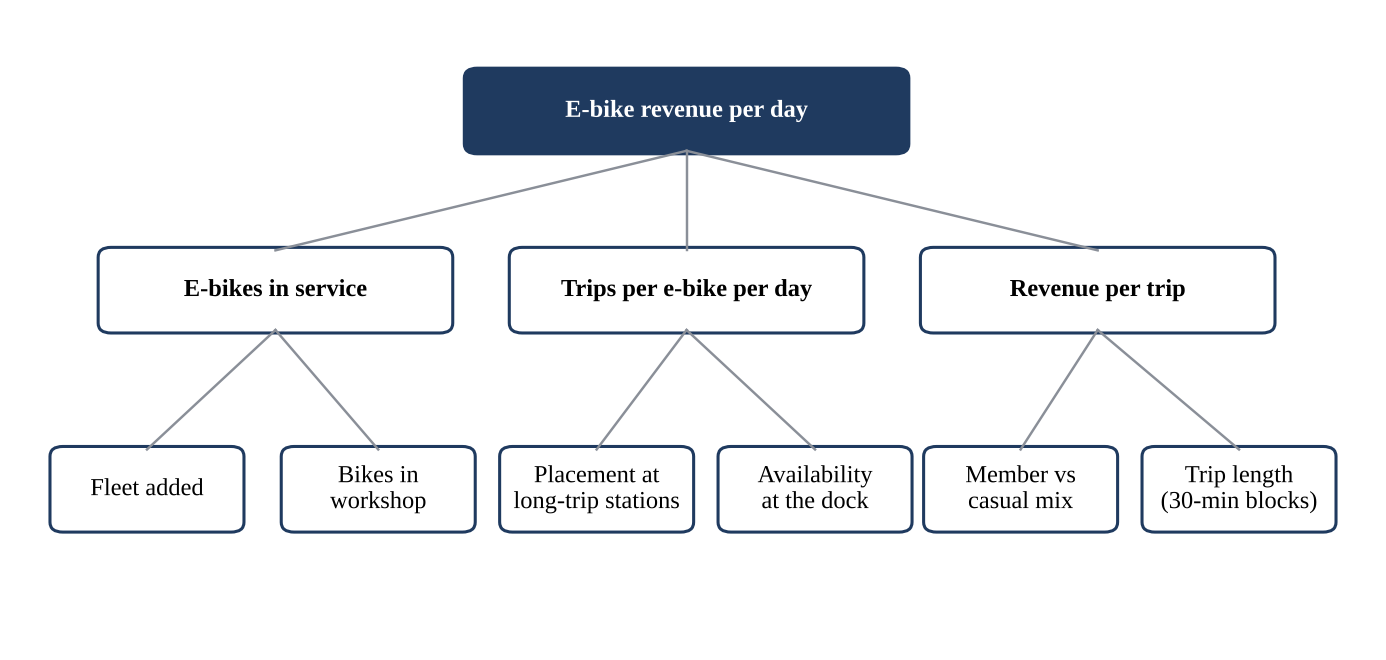
The rollout added fleet, not demand
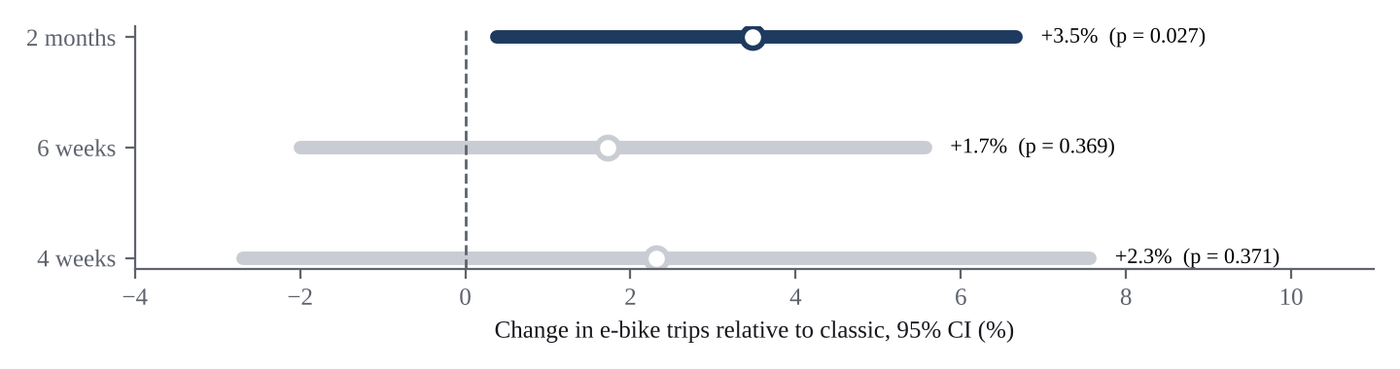
Classic bikes are the control: weather and events move both, extra supply only moves e-bikes. Counting days rather than trips is what keeps the readout honest: a trip-level test would have called a clear win.
Unit economics of the marginal e-bike
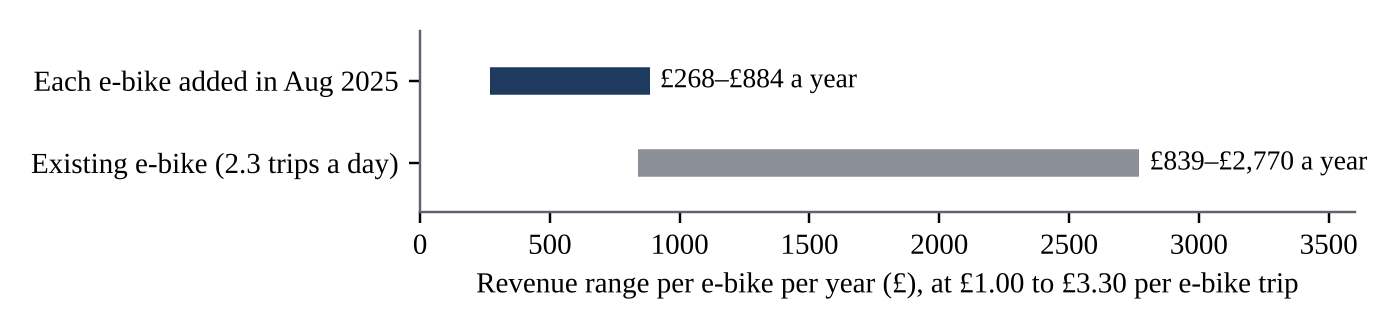
About 170 extra e-bike hires a day across 233 new bikes is roughly £270 to £880 per new e-bike a year, against £840 to £2,770 for an existing one. Fleet decisions should be judged on marginal, not average, utilisation.
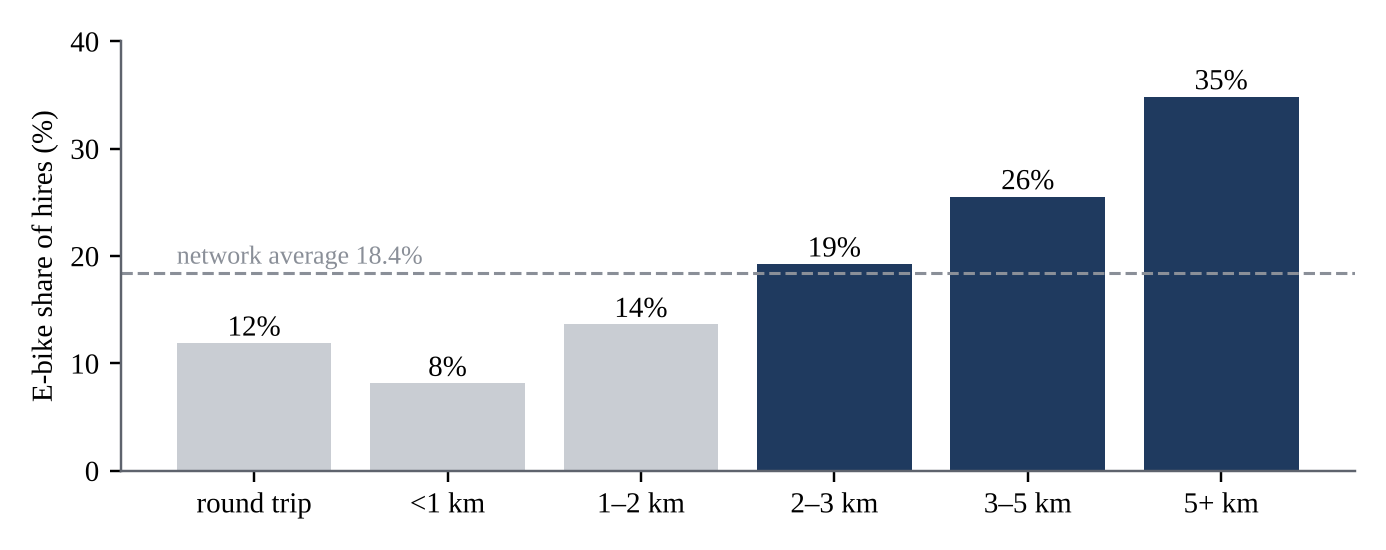
Trip length, not neighbourhood, drives e-bike choice
E-bike share peaks at 24% to 26% between 03:00 and 06:00 on weekdays and is lowest at midday (16%). It barely changes with distance from central London (17% to 19%).
Which stations are under-served
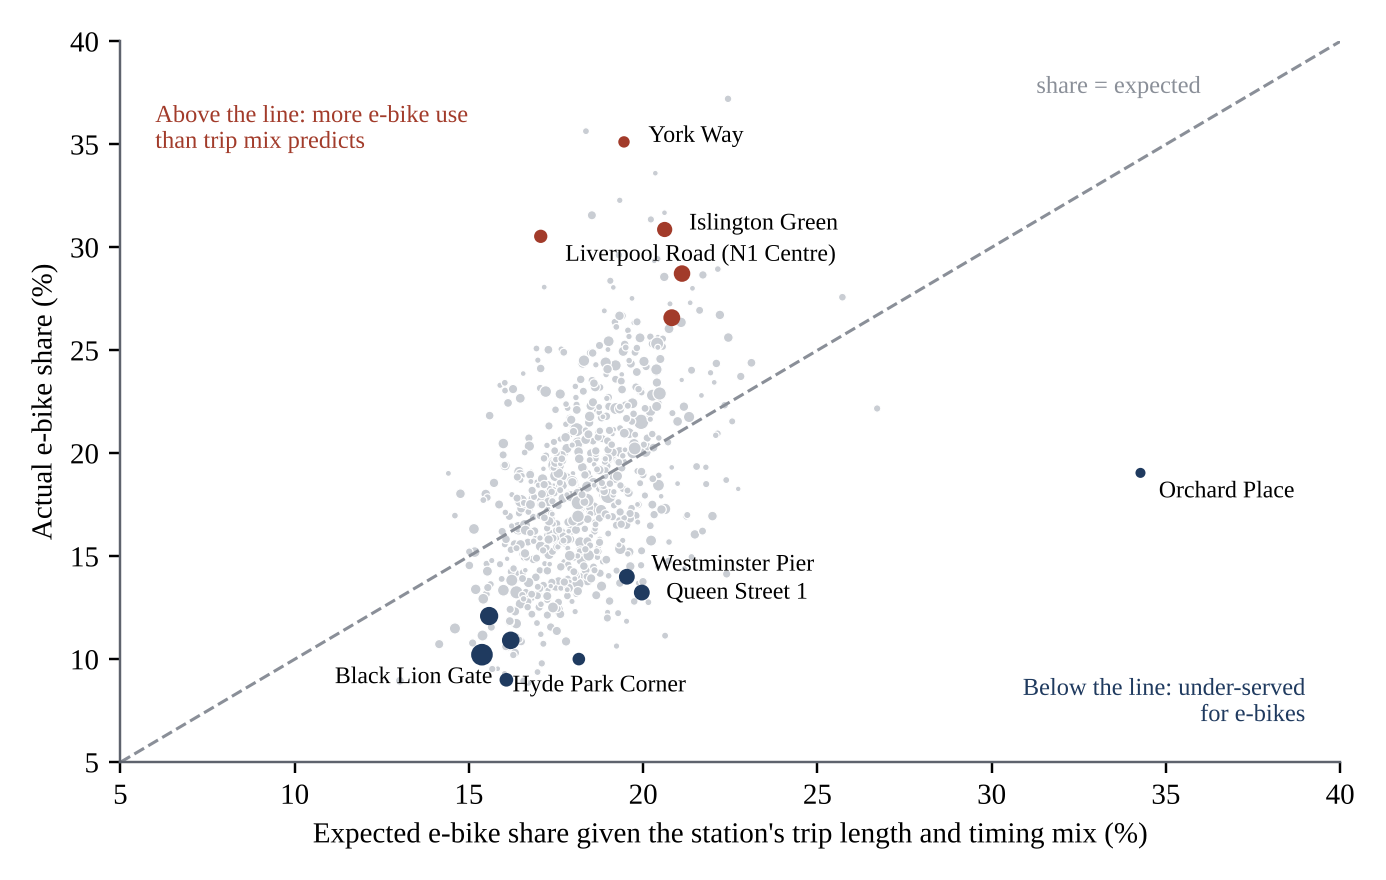
Hyde Park Corner, Kensington Gardens, South Kensington and Westminster run 5 to 7 points below their expected share; commuter stations at Angel and King's Cross run up to 15 points above. Casual riders pay twice the classic price for an e-bike, while members pay £1 extra per hour, so the gap looks like a price barrier rather than missing bikes.
Recommendations
- Re-deploy before you buy: move e-bikes towards the 50 stations that start the most long trips; no new purchases until the August batch reaches average utilisation.
- Pilot a casual e-bike offer at park and visitor stations, measured on net revenue rather than hires.
- Test, don't roll out: 25 treated and 25 control stations over eight weeks can detect a lift of about 10% to 12%, with classic hires and van time as guardrails.
- Report marginal utilisation on a shared dashboard for operations, pricing and finance.
All figures
Select a figure to enlarge it.